
Configuring Dedicated Model Inference
Quick Answer
Together AI's Dedicated Model Inference architecture integrates endpoints, deployments, and configs, enabling capacity-aware traffic routing for efficient model inference.
Quick Take
This setup supports advanced features like A/B testing and zero-downtime changes, ensuring optimal resource utilization and traffic management.
Key Points
- Endpoints serve as stable identifiers for model inference requests.
- Deployments link specific models to configs with autoscaling policies.
- Traffic routing is based on deployment weights and ready replicas.
- Config profiles optimize for GPU type, count, and performance metrics.
- New deployments require traffic split configuration to receive requests.
DeepSignal Analysis
What happened
Together AI has introduced a Dedicated Model Inference architecture that consists of endpoints, deployments, and configs. This architecture allows for capacity-aware traffic routing, enabling features like A/B testing and zero-downtime changes. The system is designed to optimize resource utilization and manage traffic effectively.
Key evidence
- The architecture includes three components: endpoints, deployments, and configs, which work together for efficient model inference.
- Traffic routing is based on a weight system that considers the number of ready replicas, allowing for proportional traffic distribution.
- Each deployment is linked to a specific model and config, with the ability to scale and absorb traffic based on its capacity.
Why it matters
This architecture is significant as it enhances the efficiency of model inference by allowing for dynamic traffic management and resource allocation. The ability to perform A/B testing and shadow experiments without downtime can lead to better model performance and user experience. Furthermore, the immutable nature of configs ensures stability and reliability in deployments.
What to watch
📖 Reader Mode
~8 min readSummary
Dedicated Model Inference on the Together AI platform consists of three parts: the endpoint (a stable name you or your clients call), deployments (specific model + hardware combinations running replicas behind it), and configs (recipes for how a model runs). A capacity-aware traffic split ties these three entities together. This architecture enables various other features such as rollouts, A/B tests, shadow experiments, zero-downtime changes possible. Below we'll show how capacity-aware routing works against a live endpoint with measured traffic.
How the resource model works
- A config is a recipe that specifies the engine, the GPU type and count as well as the parallelism and optimization profile (throughput, latency, balanced). Configs are immutable and every config has an ID like
cr_.... Your deployment always points at exactly the config that was tested. - A deployment binds one model (at a specific revision) to one config, gives it an autoscaling policy, and runs replicas. Deployments are disposable on purpose and creating and destroying should be considered routine.
- An endpoint is a fixed identity: a qualified name (
<project_slug>/<endpoint_name>) that your applications pass as themodelparameter in the ordinary inference API. The endpoint has a traffic split which is used to determine request routing over its deployments.
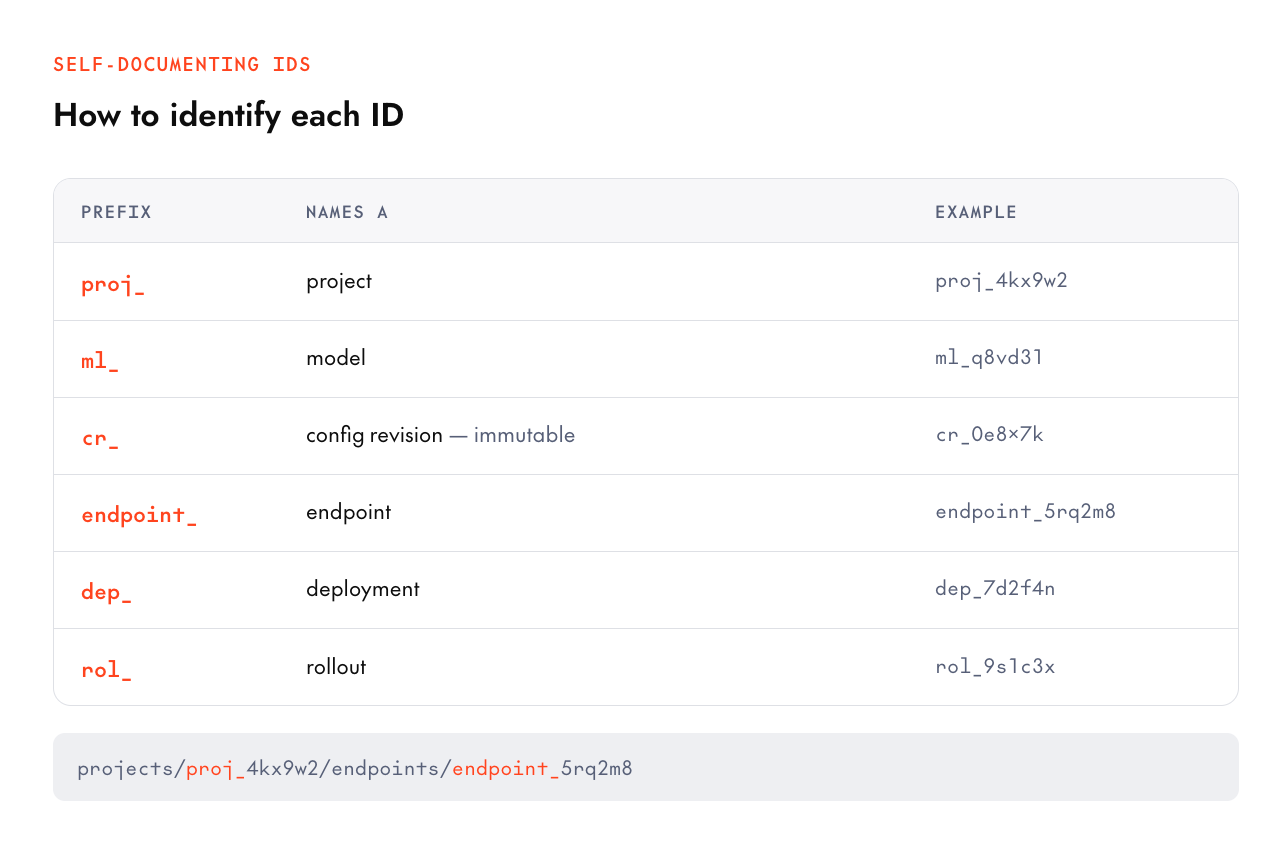
One easy way to understand this is by referring to the ID, every ID in the system tells you what it is by prefix, which makes logs and scripts self-documenting: proj_ (project), ml_ (model), cr_ (config revision), endpoint_, dep_ (deployment), rol_ (rollout).
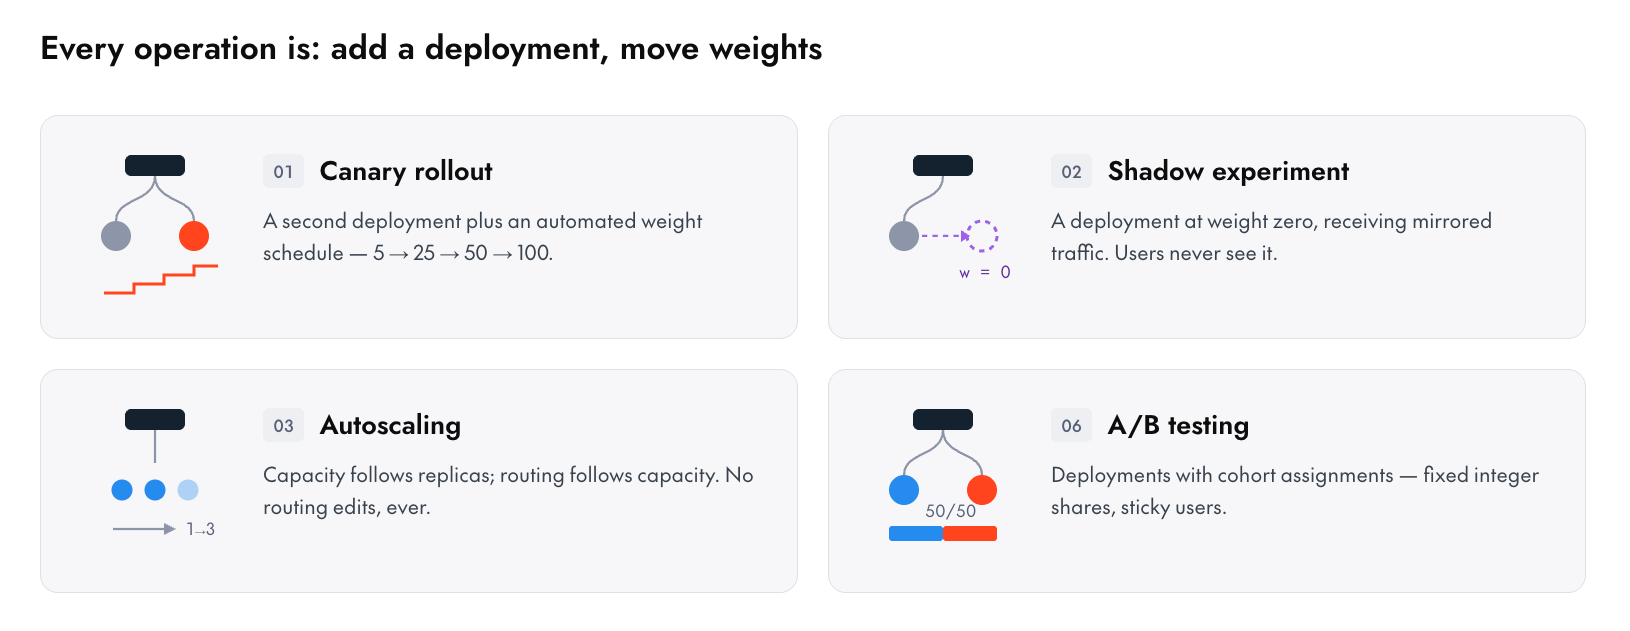
Every advanced operation in the platform is just "add a deployment, and assign it a traffic routing weight" An A/B test is deployments with cohort assignments. A shadow experiment is a deployment at weight zero receiving mirrored traffic. Stopping a deployment is bounding min and max replicas to 0/0.
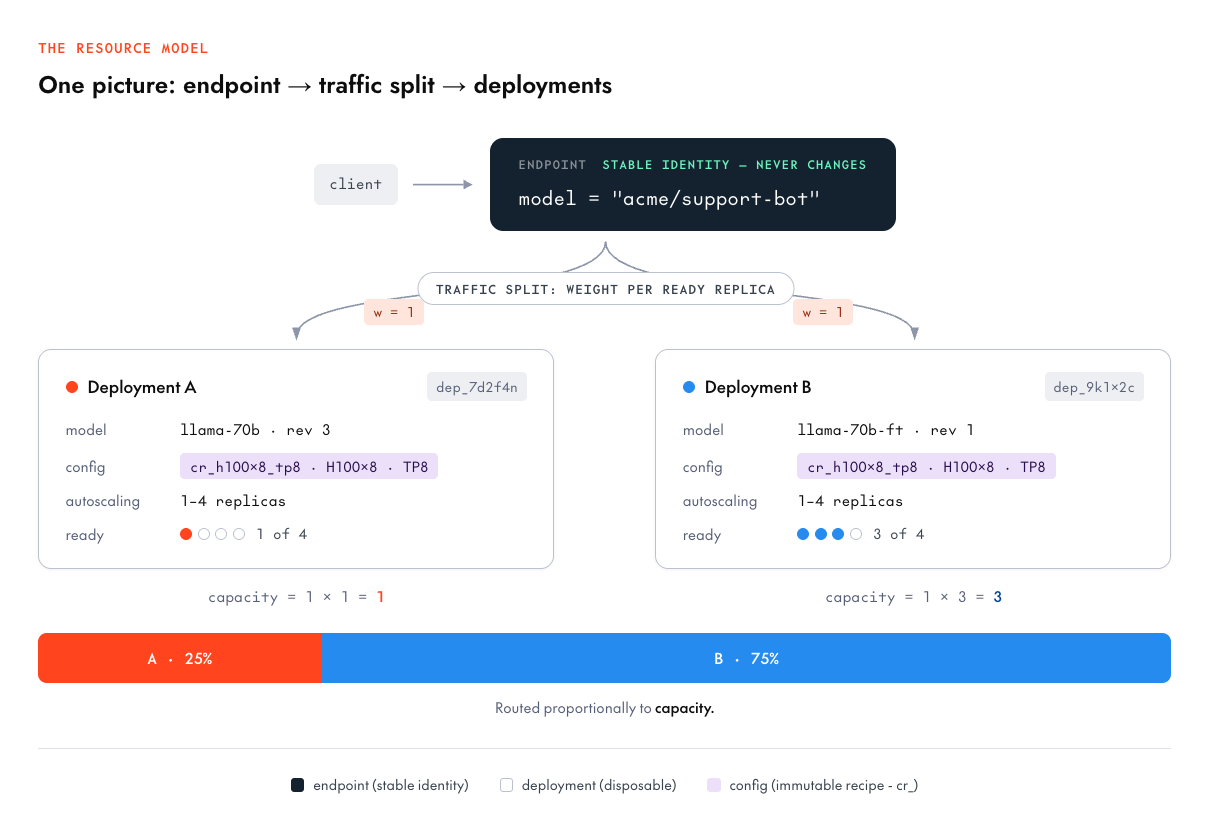
Weight based traffic split
The traffic split is a list of {deployment_id, weight} entries where a weight is per ready replica**.** The router computes each deployment's effective capacity as weight × ready_replicas and routes proportionally to this capacity.
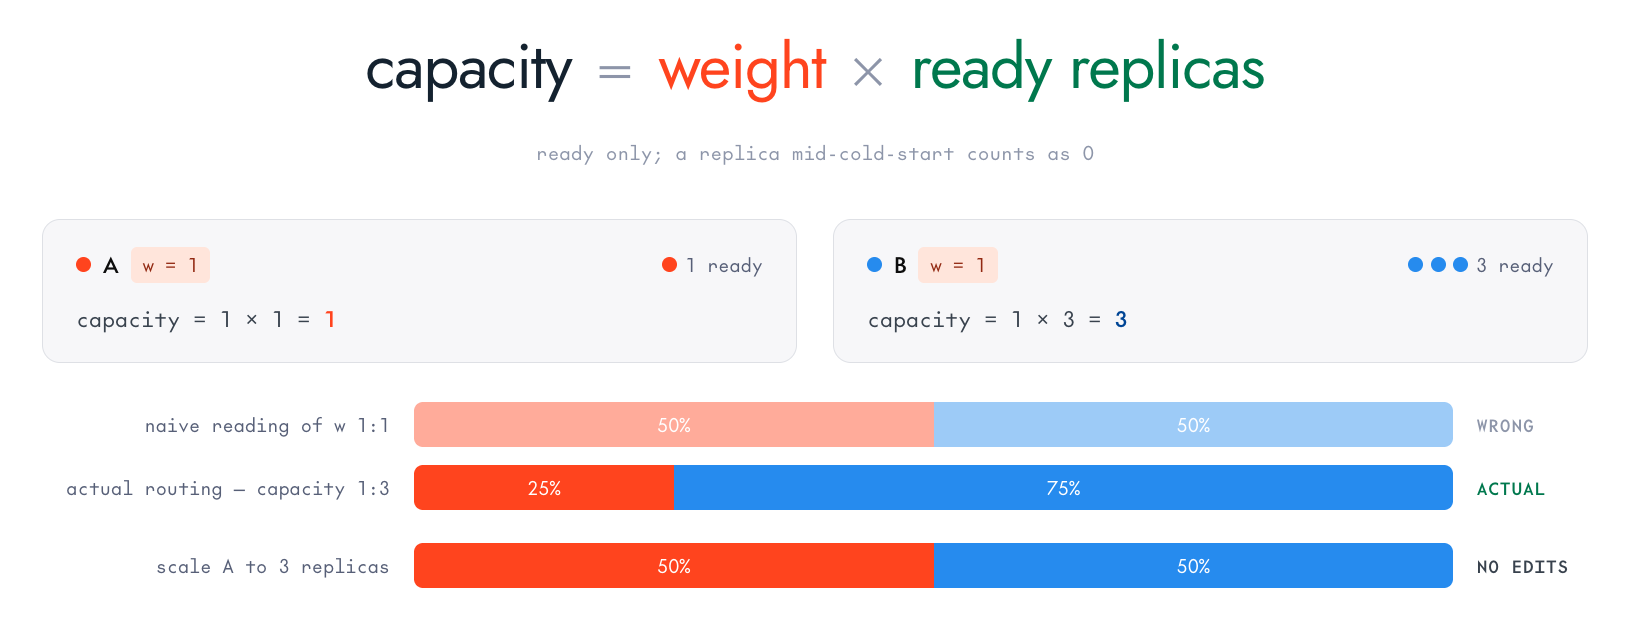
Walk through the diagram above: both deployments have weight 1 but deployment A has 1 ready replica (capacity 1), deployment B has 3 (capacity 3), so traffic follows a 25%/75% split. Equal weights mean equal per-replica load, not equal traffic share.
We designed it this way because it makes routing and scaling the same conversation:
- Autoscaling composes for free. When deployment A scales from 1 replica to 3, its capacity triples and it automatically absorbs proportionally more traffic. With naive percentages, a deployment pinned at "25%" would saturate when scaled down and be idle when scaled up.
- Per-replica load is what you control. Weight 1 vs weight 2 says "each replica of B should work twice as hard as each replica of A"
- Replicas that aren't ready don't count. A deployment mid-cold-start, or degraded to 0 ready replicas, contributes zero capacity, so traffic flows to what can actually serve.
Weights are positive numbers with no sum constraint so 0.7/0.3 and 700/300 describe identical routing. If you want fixed traffic shares regardless of replica count you can setup A/B experiment cohorts which allow for integer percents that sum to 100%.
Setting a split is one PATCH with a field mask:
      tg beta endpoints update $DEPLOYMENT_A --traffic-weight 1
tg beta endpoints update $DEPLOYMENT_B --traffic-weight 1

# take a deployment out of rotation without scaling it down
tg beta endpoints update $DEPLOYMENT_B --traffic-weight 0
⚠️ Important

A brand-new deployment will not get any traffic until it appears in the endpoint's traffic split. If you create an endpoint and a deployment and have it `READY`, send a request, and get back a `routing_error` it is probably because the traffic split is not specified and the router hasn’t yet been told that this deployment should receive traffic. The CLI's `together beta endpoints deploy` sets the split for you, which is why the quickstart "just works" but the raw-API/SDK path needs this set.
Under the hood: choosing a config
You don't need to write configs from scratch. Every model in the supported-models catalog ships with deployment profiles which are certified model + config pairs we benchmark and continuously improve:
      tg beta models public zai-org/GLM-5.2 --json | jq '.data[0].deploymentProfiles[]'

# or, once you have the model ID, list its deployable configs directly:
tg beta models configs ml_CcEtnFUbitJYNja6TTR6U
{
  "profileId": "profile-cabcbcec874c",
  "certifiedConfigRevisionId": "cr_Cd35DNpQuHM3RihtCkN59",
  "certifiedModelRevisionId": "rv_CcEuPu4Gk6c4M7v4PTYuG",
  "gpuType": "NVIDIA-B200",
  "gpuCount": 4,
  "quantization": "FP4",
  "performanceBenchmarks": {},
  "config": "projects/proj_CbdXDuLRFhUPv1mGfxwUc/configs/cr_Cd35DNpQuHM3RihtCkN59",
  "model": "projects/proj_CbdXDuLRFhUPv1mGfxwUc/models/ml_CcEtnFUbitJYNja6TTR6U/revisions/rv_CcEuPu4Gk6c4M7v4PTYuG",
  "parallelism": "TP4"
}
From there you can copy the model and config resource names into a deployment create:
      tg beta endpoints deploy zai-org/GLM-5.2 \
  --endpoint my-glm-endpoint \
  --config cr_Cd35DNpQuHM3RihtCkN59 \
  --traffic-weight 1
When you're choosing between configs, the selectors tell you what each recipe optimizes:
| Selector | Values | The tradeoff it encodes | ||
|---|---|---|---|---|
| accelerator_type | H100, H200, B200, … | Cost vs memory bandwidth vs availability | ||
| accelerator_count | 1, 2, 4, 8 | Fit the model + KV-cache headroom | ||
| optimization | latency / throughput / balanced | The fundamental serving tradeoff (below) | ||
| topology | e.g. aggregated/disaggregated | How the model splits across GPUs |
The optimization axis is the one you'll spend the most time choosing between.
- A latency profile optimizes for time-to-first-token: smaller batches, eager scheduling, each request gets attention sooner, at the cost of total tokens/sec per GPU.
- A throughput profile packs bigger batches: maximizing aggregate tokens per GPU-hour, and individual requests wait a bit longer to join a batch. If you’re building an interactive chat you probably want to go with latency whereas offline pipelines and batch summarization can use a throughput config.
- balanced is a good default when your traffic has both.
Configs are immutable because cr_ revisions never change, i.e. a deployment's behavior can't drift because someone "just tweaked a flag" on a shared config. A change is a new revision; the old one remains a valid, tested rollback target. Speculative decoding can be triggered from here too because a draft model is a property of the config.
Edge cases
1. A deployment is in the split but has 0 ready replicas.
Because capacity = weight × 0 = 0 it receives no traffic; other deployments will absorb its share. When replicas recover, traffic flows back automatically and proportionally.
2. Can I delete a deployment that's still in the traffic split?
You should remove it from the split first, then delete. The teardown sequence consists of drain traffic → stop → delete, and the API will push you towards that order.

3. Traffic splits vs. A/B member percents vs. canary step percentages
traffic-split weights (capacity-relative, steady-state routing), A/B member percents (integer cohort shares, sum to 100 and are fixed regardless of replica counts), and canary step percentages (a rollout's transition schedule). These are three different tools for three different jobs and they compose in a fixed order: routing first resolves the weight split (a candidate deployment sampled by capacity), then an A/B experiment re-samples if the candidate is its control (subdividing the control's share among the arms), then an active rollout re-samples if the candidate is its source (splitting between source and target by the current step percentage) and finally a cluster is chosen inside the winning deployment. A rollout manipulates its stage on your behalf.

4. What is the name my clients use?
The endpoint which looks something like: <project_slug>/<endpoint_name> can be passed as a model string in the standard inference API. This will stay the same even if you choose to perform a rollout, swap hardware, run A/B tests.
Experiment showing capacity-aware routing
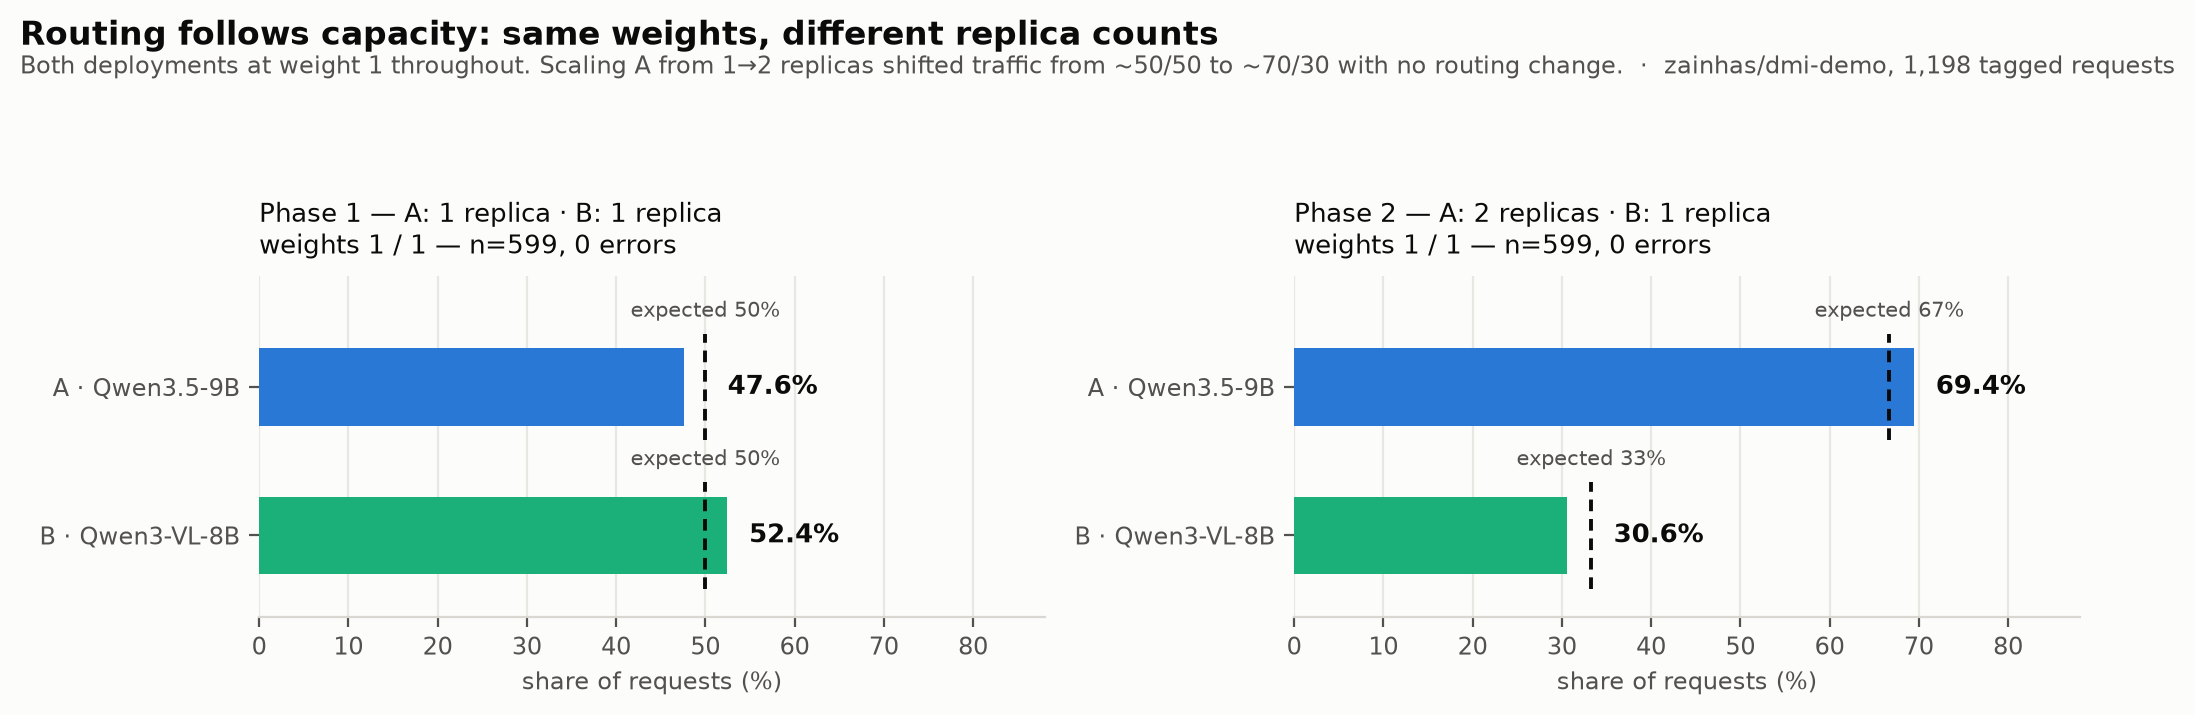
We ran this against a live endpoint with two single-H100 deployments to show the weight model traffic split in action. Two deployments each with weight 1 and each starting with 1 ready replica. We sent 599 tagged requests and attributed each to its serving deployment, then scaled A from 1 → 2 replicas and sent 599 more requests and the following routing was captured as seen by the deployments:
| Phase | Replicas (A : B) | Expected share | Measured share | n |
|---|---|---|---|---|
| 1 | 1 : 1 | 50 / 50 | 47.6 / 52.4 | 599 |
| 2 | 2 : 1 | 66.7 / 33.3 | 69.4 / 30.6 | 599 |
| optimization | latency / throughput / balanced | The fundamental serving tradeoff (below) | ||
| topology | e.g. aggregated/disaggregated | How the model splits across GPUs |
Because routing follows capacity which in turn followed the replicas. Within deployment A, its two pods each carried ~30–40% of total traffic (39.6% and 29.9%), the router balances across pods, too.
To make the profile tradeoff concrete, we swept the two certified profiles from our demo endpoint with one replica each, 60-second closed-loop levels at concurrency 4 / 8 / 16, 200-token generations, token counts taken from the API's own usage field:

| Profile | c=4 | c=8 | c=16 | TTFT p95 @ c16 |
|---|---|---|---|---|
| A · Qwen3.5-9B (BF16, TP1) | 362 tok/s | 789 tok/s | 1,464 tok/s | 368 ms |
| B · Qwen3-VL-8B (BF16, TP1) | 495 tok/s | 243 tok/s | 240 tok/s | 323 ms |
| optimization | latency / throughput / balanced | The fundamental serving tradeoff (below) | ||
| topology | e.g. aggregated/disaggregated | How the model splits across GPUs |
This table is the whole argument for measuring: B wins at low concurrency, then degrades sharply. A batches well with 4× the throughput from c4 to c16 with TTFT p95 rising only ~17%. B is faster than A at concurrency 4, then saturates: past c≈4 its effective request rate stops growing, aggregate throughput halves, and a few requests per minute begin to stall outright. If you'd only load-tested at concurrency 4, you'd have picked B for a high-concurrency workload and only found out about this behavior in production.
Neither profile is "wrong" they're just different points on the serving frontier, and profiles for your model will have their own curves. The starting configs give you a way to test starting points; a one-hour sweep like this one tells you which one fits your traffic.
Try it yourself!
The whole model, in five commands:
      # 1. Identity: who am I / what project
tg whoami

# 2. Pick a certified profile for your model
tg beta models public --product dedicated

# 3. One command: endpoint + deployment + traffic split + wait
tg beta endpoints deploy $MODEL --endpoint my-endpoint --traffic-weight 1

# 4. Call it — the qualified name is the model string
resp = client.chat.completions.create(
model="my-project/my-endpoint",   # the endpoint's qualified name IS the model string
messages=[{"role": "user", "content": "Hello!"}],
)

# 5. See what you built
together beta endpoints get $ENDPOINT_ID
From here, everything else in this series is one more deployment away.
📚 Docs: Dedicated Model Inference → Quickstart · Concepts · Route traffic
— Originally published at together.ai
Want this in your inbox every morning?
Daily brief at your local 8am — bilingual EN/中文, free.
More from Together AI
See more →
Open, convenient and predictable: Introducing Provisioned Throughput
Together AI introduces Provisioned Throughput, offering guaranteed inference capacity for MiniMax M3 and GLM-5.2 at $0.05 per PTU per minute, achieving costs up to 90% lower than Claude Opus 4.8. This new model provides predictable pricing and a 99% uptime SLA, catering to companies transitioning to open weight models for production workloads.