Building multi-Region visualizations with Highcharts in Amazon Quick
Quick Answer
Integrating Highcharts with Amazon QuickSight enables unified multi-region visualizations for carrier performance, overcoming native chart limitations.
Quick Take
This approach allows for detailed insights across diverse competitive structures while ensuring compliance with data residency laws.
Key Points
- Highcharts enhances QuickSight by enabling complex visualizations like radar and bullet charts.
- Two architectural options exist for data residency: single region or separate regions per country.
- Option 2 ensures compliance with GDPR by keeping UK data in EU regions and US data in US regions.
- Unified dashboards can be created without moving raw data across borders using federated datasets.
- Highcharts configurations support various chart types for comprehensive performance analysis.
DeepSignal Analysis
What happened
Amazon QuickSight users can now integrate Highcharts for enhanced multi-region visualizations of carrier performance data. This integration addresses limitations of native QuickSight charts, allowing for complex comparisons across different competitive structures in the US and UK. Users can create unified dashboards that comply with data residency laws.
Key evidence
- Highcharts enables the use of advanced chart types like radar, bullet, and dumbbell charts, which are not available in native QuickSight visualizations.
- The architecture allows for separate AWS Regions for US and UK data, ensuring compliance with GDPR and data residency laws.
- Users can federate aggregated datasets from different regions without moving raw data across borders, maintaining data sovereignty.
Why it matters
This integration is significant for businesses operating in multiple regions, particularly in regulated industries like telecommunications. It allows for a more nuanced analysis of carrier performance, which is essential for making informed, data-driven decisions. By overcoming the limitations of native visualizations, organizations can better understand competitive dynamics and improve their strategic positioning.
📖 Reader Mode
~24 min readWhen your carrier performance data spans multiple regions, your dashboard must reconcile fundamentally different competitive structures within a single view. For example, in the US, you rank three carriers (Carrier 1–3) across 49 states and hundreds of metro markets. In the UK, you’re comparing four carriers (Carrier 4–7) across a separate set of national regions. The challenge you face is not only geographic but also structural.
The differences in carrier count, market density, and regional detail between these two geographies mean that no single out-of-the-box chart type can tell your full story. You need visualizations that answer layered questions simultaneously: who leads, by how much, how consistently, and whether they are improving or declining.
You will find that native Amazon Quick visualizations do not tell your full story when you try to answer these questions at scale. Amazon Quick Sight can’t encode which carrier or combination of carriers dominates each geographic tile. It can’t render a radar chart that profiles all seven carriers across seven performance categories simultaneously. And it can’t produce chart types such as bullet charts and dumbbell charts, which you need to surface the nuances in your data.
Every time you try to approximate these visuals in native Quick Sight, you end up building separate dashboards per Region, using stacked bar workarounds for deltas, or averaging metrics that mask volatility between a carrier’s best and worst markets. These compromises add maintenance overhead and obscure the insights your stakeholders need to make confident, data-driven decisions.
By embedding Highcharts as a custom visual in Quick Sight, you address these limitations with a single, unified JSON configuration. With its tilemap chart type and colorAxis.dataClasses, you can encode carrier dominance (including multi-carrier ties) across multiple regions in one visual, with legend toggles for region filtering. Its polar line chart renders a true polygon radar for multi-carrier, multi-category comparison, giving you the full competitive profile.
Beyond geographic and radar views, Highcharts unlocks the chart types your analysis demands. You can use bullet charts to show performance against a 100-point target with color-banded zones, dumbbell charts to expose the spread between a carrier’s best and worst metro market, and waterfall charts to break down period-over-period score deltas.
This post shows you how to build multi-Region carrier performance dashboards in Quick Sight using Highcharts custom visualizations to overcome native chart limitations. You will learn how to maintain data sovereignty across AWS Regions while creating unified visualizations through the Quick Sight federated dataset capability. The solution includes production-ready chart configurations and addresses security, compliance, and scalability requirements.
Solution overview
Your architecture depends on factors such as data residency requirements, latency needs, and compliance obligations. Two architectural patterns address this:
Option 1: Single AWS Region
With this approach, you store carrier data (for example, both US and UK) in one AWS Region (for example, us-east-1 or eu-west-1), using a single Quick Sight SPICE (Super-fast, Parallel, In-memory Calculation Engine) dataset with a country column to logically identify the data.
While this architecture is simpler for you to manage with one dataset and one SPICE refresh, it carries a potential drawback: if you choose a US-based Region, your data physically resides outside the UK, which may conflict with the UK General Data Protection Regulation (GDPR) or data residency rules if your dataset contains personally identifiable information (PII).
Option 2: Separate AWS Regions per country
Sometimes, data sovereignty laws require you to physically store and process certain categories of data (particularly data about individuals, network usage patterns, and commercially sensitive performance metrics) within the legal jurisdiction where you collected the data. For example, for UK carrier data, the UK GDPR (retained post-Brexit) mandates that personal and operationally sensitive data about UK consumers and UK network performance must reside on infrastructure located within the UK or the broader European Economic Area. This means that you must place US carrier data in a US AWS Region (for example, us-east-1 or us-west-2) and UK carrier data in an EU-adherent Region, with no co-mingling of raw data across those boundaries. The two datasets are sovereign. You can’t merge them into a single Amazon Simple Storage Service (Amazon S3) bucket without violating one or both jurisdictions’ requirements.
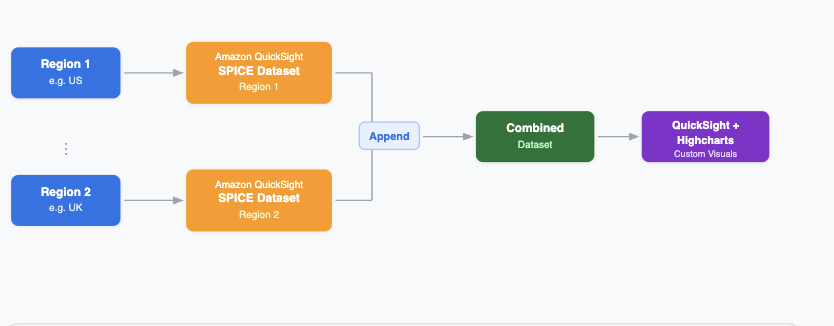
Despite the data residing in separate AWS Regions, you can build a single unified Highcharts dashboard using Quick architecture without moving raw data across borders. You use federated dataset joins at the Quick layer rather than at the storage layer: you ingest the aggregated US dataset (in us-east-1) and the aggregated UK dataset (in eu-west-2) into their respective regional SPICE instances, and the Data Prep capability of Amazon Quick appends them at data prep time into a single logical dataset. The resulting unified dataset feeds a single set of Highcharts configurations (tilemap, radar, bullet, dumbbell, waterfall, streamgraph) that render multi-Region carriers together. No raw sovereign data leaves its home Region. You federate only the aggregated RootScore, Rank, and ColorValue metrics computed within each Region into the unified view, satisfying data residency requirements while still enabling the combined visualizations your dashboard requires.
While Option 1 suits most scenarios, the post walks you through Option 2 because it addresses the more complex requirements that telecommunications companies frequently encounter.
Solution architecture
The following diagram shows how the multi-Region architecture federates carrier performance data while maintaining data sovereignty. Two regional data pipelines, one in us-east-1 for US carrier data and one in eu-west-2 for UK carrier data independently aggregate performance metrics within their respective Regions. At the Quick layer, the Data Prep capability federates these aggregated datasets at query time into a single logical dataset. This unified dataset feeds the Highcharts custom visuals, enabling a combined multi-Region dashboard without moving raw data across borders
Prerequisites
Before you begin, make sure that you have the following:
- An AWS account with access to Quick.
- Data sources configured across multiple AWS Regions.
- Basic familiarity with Quick Sight dashboards and data integration.
- Understanding of JSON configuration for Highcharts.
- AWS Identity and Access Management (IAM) permissions to access data sources across regions.
Data preparation
To aggregate data from multiple regions, configure your data sources in Quick. This step helps you establish the connections that enable cross-Region data retrieval.
- In the Quick console, navigate to Datasets from the left navigation panel.
- Choose Create data source to begin adding your first regional data source.
- Select your data source type (such as Amazon S3, Amazon Relational Database Service (Amazon RDS), or another data source of your choice).
- Enter the connection details for your first region, including endpoint URLs and authentication credentials.
- Choose Validate connection to verify data accessibility.
- After validating the connection, choose Create data source.
- Repeat steps 2–6 for each additional AWS Region that you want to include in your analysis.
After configuring your regional data sources, you can proceed to combine them into a unified dataset.
Configure data aggregation and transformation
After connecting your data sources, set up aggregation rules to combine data from multiple regions. This step helps maintain consistent data formatting and produces a unified analysis.
- Choose Datasets under Quick.
- Choose Create dataset.
- Select one of the data sources you registered in the previous section and its associated schema.
- Choose Edit/Preview data.
- In the Data Preparation interface, choose Add data.
- Select your second regional data source from the list.
- Choose Append to stack the datasets vertically.
- Verify that column names match between datasets (rename if needed).
- Add a calculated field named
Regionto identify data origin (for example,IF(condition, 'US', 'UK')). - Preview the combined dataset to verify row counts.
- Add calculated fields to normalize data formats across regions if needed. For example, convert timestamps to a common time zone.
- Choose Save & publish to publish your aggregated dataset.
- After you publish the dataset, configure the refresh schedule for this dataset under Schedule refresh to keep your aggregated data current.
- Set the frequency based on your business requirements (hourly, daily, or weekly).
You can now create Highcharts visualizations using your aggregate dataset.
To learn how to set up cross-region analytics data for your Highcharts visualizations, see this walkthrough on building a multi-Region analytics solution.
Dataset overview
The carrier performance dataset used in this walkthrough contains records spanning seven carriers across two countries (UK, USA). The dataset includes seven performance categories (Call, Data, Overall, Reliability, Responsiveness, Text, Video), with rankings and RootScore metrics across two measurement periods (2024-2H, 2025-1H).
The dataset schema consists of the following attributes:
| Field | Description |
| carrier | Carrier ID (for example, Carrier1 through Carrier7) |
| category | Performance category (Call, Data, Overall, Reliability, Responsiveness, Text, Video) |
| country | Country of measurement (USA, UK) |
| rank | Competitive ranking (1–4) within that market and category |
| rootscore | Performance score (0–100 scale) |
| product_period | Measurement period (2024-2H, 2025-1H) |
The following table shows a representative sample from the dataset:
| carrier | category | country | rank | rootscore | product_period |
| Carrier1 | Call | USA | 1.0 | 99.53 | 2024-2H |
| Carrier1 | Call | USA | 1.0 | 98.08 | 2024-2H |
| Carrier1 | Call | USA | 1.0 | 82.18 | 2024-2H |
| Carrier1 | Call | USA | 1.0 | 99.99 | 2024-2H |
| Carrier1 | Call | USA | 1.0 | 98.79 | 2024-2H |
| Carrier1 | Call | USA | 1.0 | 98.37 | 2024-2H |
| Carrier1 | Call | USA | 1.0 | 99.96 | 2024-2H |
| Carrier1 | Call | USA | 1.0 | 99.12 | 2024-2H |
Understanding dynamic field well bindings
The code blocks in this post show how data flows dynamically from the dataset by using placeholder tokens ({{token}}) that map to specific dataset queries.
Each code block includes two components:
- The field well mapping specifies which dataset fields (
carrier,category,rootscore,rank,product_period,country) map to which field wells. These define how data flows from the dataset into the chart. - The JSON template uses placeholder tokens (for example,
{{carrier_list}}and{{avg_rootscore_period_1}}) that the Quick Sight field well engine resolves at render time. The mapping legend that follows each chart documents what each placeholder resolves to.
Highcharts implementation walkthrough
In this section, you walk through Highcharts visualizations that address the multi-Region carrier analysis requirements that native Quick Sight visuals can’t fulfill on their own. Before diving into the code, review the following requirements table. It maps each visualization to its Highcharts chart type, summarizes what the visual must accomplish, and explains why you cannot achieve the same result with built-in Quick Sight chart types. Each chart that follows includes a complete JSON configuration you can copy directly into your Quick Sight Highcharts custom visual, along with a rendered preview showing the expected output. Because every configuration binds dynamically to the Quick Sight field wells rather than hardcoding carrier names or region values, you can adapt these examples to your own dataset without rewriting the JSON. Only your lookup table needs to reflect your carriers and regions.
Requirements
| # | Visual name | Highcharts type | Requirement summary | Why Highcharts |
| 1 | US Carrier Performance Radar | polar + line | Spider/polygon chart showing each US carrier’s average score across seven categories (Call, Data, Overall, Reliability, Responsiveness, Text, Video). | No polar or radar chart type in Quick Sight. You can’t create a multi-axis, multi-carrier overlay with a polygon grid natively. |
| 2 | Overlapping Column Chart with Target Bubbles | column | Compare 2024-2H and 2025-1H RootScore for all seven carriers in a single view. The 2024-2H column renders a wider solid bar. The 2025-1H column overlaps it as a semitransparent overlay. Orange bubbles at y=100 mark the target, and a dashed red reference line reinforces the benchmark. | No similar chart type in Quick Sight. If you use stacked bar workarounds, you lose the delta narrative entirely. |
| 3 | Variwide Chart: Win Share × Volume | variwide | Carrier1 win % as bar height. Total #1 wins in that category as bar width, thus two key performance indicators in one bar. | All Quick Sight bars have equal fixed width. You can’t encode a second dimension (market volume) into bar width. |
| 4 | Streamgraph: Win Flow | streamgraph | Flowing stream width per carrier showing #1 Overall win count across periods and reveals competitive momentum. | No streamgraph type in Quick Sight. The organic flowing proportional share shape is exclusive to Highcharts. |
| 5 | Hexagonal Tilemap for Market Share | tilemap | A hexagonal grid where each tile represents ~1% of markets won. Carriers fill the grid proportionally to their share, creating an immediately intuitive visual of competitive concentration. | Quick Sight built-in map visuals (filled maps, point maps) render geographic shapes or coordinates, not abstract hex grids. There’s no native “tilemap” or hex-bin chart type. |
| 6 | Combined US + UK Packed Bubble | packedbubble | All carriers in a single packed bubble configuration with distinct cluster regions per carrier. | No packed bubble type is available. You can’t group carriers into distinct cluster regions within one visual. |
Create a Highcharts custom visual
To build each visualization, follow these steps:
- Navigate to Analyses and open your analysis.
- Add a Highcharts visual.
- Map the analysis to your prepared dataset.
- Update the JSON configuration in the format panel.
- Map your dataset fields to the field wells referenced in the JSON.
- Verify that the chart renders correctly.
Chart 1: Average overall RootScore, 2024-2H compared to 2025-1H
The following chart compares the average overall RootScore for all seven carriers across two measurement periods (2024-2H and 2025-1H). Each carrier displays two overlapping columns, a wider solid bar for the earlier period and a semitransparent overlay for the later period so you can immediately see period-over-period improvement or decline. Orange bubbles positioned at 100 mark the target score, and a dashed red reference line reinforces this benchmark. You can observe that Carriers 1–3 consistently score above 95 and approach the 100 target, while Carriers 5–7 remain below 90, highlighting a clear performance gap between the two groups.
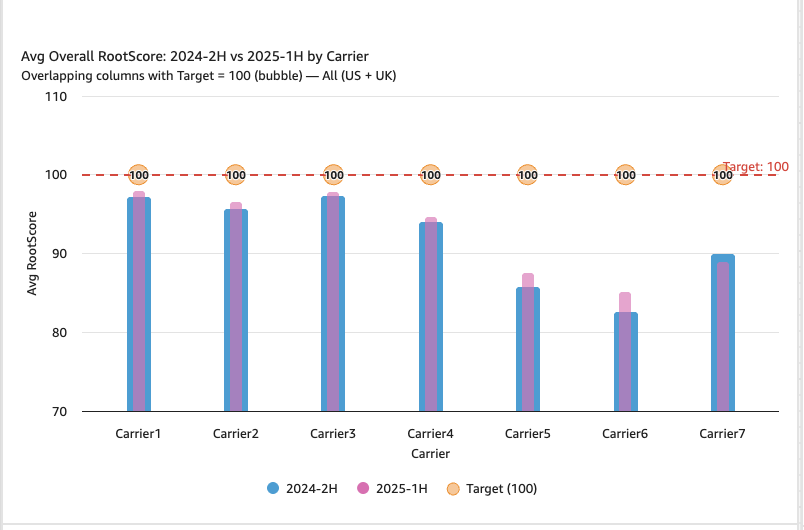
Overlapping column chart comparing average overall RootScore for 2024-2H versus 2025-1H across seven carriers. Orange bubbles mark the target score of 100, with a dashed red reference line. Carriers 1–3 score above 95, while Carriers 5–7 score below 90.
{
    "chart": { "type": "column" },
    "title": { "text": "Avg Overall RootScore: {{period_1}} vs {{period_2}} by Carrier" },
    "subtitle": { "text": "Overlapping columns with Target = 100 (bubble) --- All ({{country_list}})" },
    "xAxis": {
        "categories": {{carrier_list}},
        "title": { "text": "Carrier" }
    },
    "yAxis": {
        "min": 70, "max": 103,
        "title": { "text": "Avg RootScore" },
        "labels": { "format": "{value}" },
        "plotLines": [{ "value": 100, "color": "#E53935", "dashStyle": "Dash", "width": 2, "label": { "text": "Target: 100", "align": "right", "style": { "color": "#E53935" } }, "zIndex": 5 }]
    },
    "tooltip": { "shared": false },
    "plotOptions": {
        "column": { "grouping": false, "shadow": false, "borderWidth": 0 },
        "bubble": { "minSize": 20, "maxSize": 20, "zThreshold": 0 }
    },
    "series": [
        { "type": "column", "name": "{{period_1}}", "data": {{avg_rootscore_period_1}}, "color": "#219FD7", "pointPadding": 0.3, "pointPlacement": 0, "tooltip": { "valueSuffix": "" } },
        { "type": "column", "name": "{{period_2}}", "data": {{avg_rootscore_period_2}}, "color": "#E66AB4", "pointPadding": 0.4, "pointPlacement": 0, "opacity": 0.8, "tooltip": { "valueSuffix": "" } },
        {
            "type": "bubble", "name": "Target (100)",
            "data": {{target_bubble_data}},
            "color": "#FB8C00", "marker": { "symbol": "circle" },
            "dataLabels": { "enabled": true, "format": "100", "style": { "fontWeight": "bold" } },
            "tooltip": { "pointFormat": "<b>{point.name}</b><br/>Target: 100<br/>Gap from {{period_1}}: {point.gap2024}<br/>Gap from {{period_2}}: {point.gap2025}" },
            "zIndex": 10
        }
    ]
}
Placeholder mapping legend:
{{carrier_list}} → DISTINCT(carrier) ORDER BY carrier → ["Carrier1", "Carrier2", "Carrier3", "Carrier4", "Carrier5", "Carrier6", "Carrier7"]
{{period_1}} → First product_period value → "2024-2H"
{{period_2}} → Latest product_period value → "2025-1H"
{{country_list}} → DISTINCT(country) joined → "UK + USA"
{{avg_rootscore_period_1}} → AVG(rootscore) WHERE category='Overall' AND product_period='2024-2H' GROUP BY carrier → [97.2, 95.66, 97.33, 93.97, 85.71, 82.56, 89.93]
{{avg_rootscore_period_2}} → AVG(rootscore) WHERE category='Overall' AND product_period='2025-1H' GROUP BY carrier → [97.92, 96.53, 97.83, 94.65, 87.52, 85.06, 88.93]
{{target_bubble_data}} → Per carrier: {x: idx, y: 100, z: 15, name: carrier, gap2024: 100-AVG, gap2025: 100-AVG}
The following variwide chart encodes two dimensions of competitive performance in a single visualization. Bar height represents Carrier1’s win share percentage in each performance category, and bar width represents the total number of first-place rankings across all carriers in that category (market volume). This dual encoding lets you see not only where Carrier1 wins most frequently, but also how competitive the category is overall. Categories where the bar is both tall and wide indicate strong Carrier1 dominance in high-volume markets. For example, the Call category shows the highest win share at approximately 48% with substantial market volume.
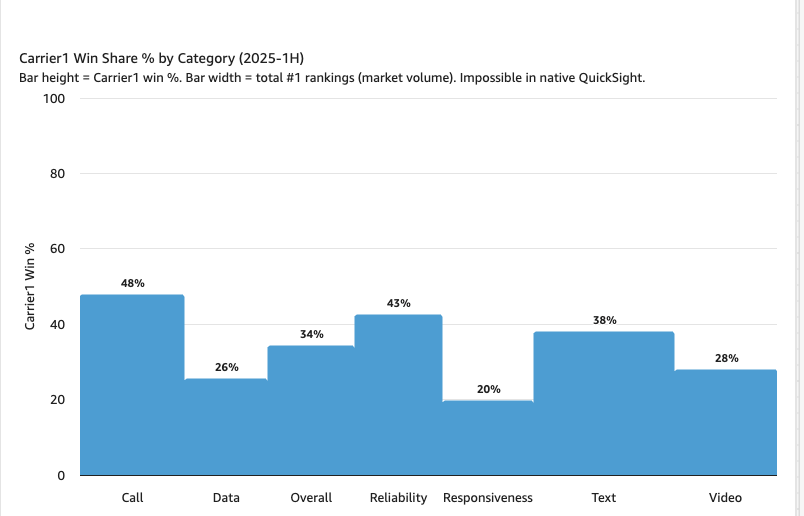
Variwide chart showing Carrier1 win share percentage by category for 2025-1H. Bar height represents win percentage, bar width represents total number of first-place rankings. Call category shows highest win share at 48 percent, followed by Reliability at 43 percent.
{
    "chart": { "type": "variwide" },
    "title": { "text": "{{lead_carrier}} Win Share % by Category ({{period_2}})" },
    "subtitle": { "text": "Bar height = {{lead_carrier}} win %. Bar width = total #1 rankings (market volume). Impossible in native Quick Sight." },
    "xAxis": { "type": "category" },
    "yAxis": { "title": { "text": "{{lead_carrier}} Win %" }, "max": 100 },
    "legend": { "enabled": false },
    "tooltip": { "pointFormat": "<b>{point.name}</b><br>{{lead_carrier}} Win%: <b>{point.y:.1f}%</b><br>Total #1 wins in market: <b>{point.z}</b>" },
    "series": [{
            "name": "{{lead_carrier}} Win %",
            "color": "#219FD7",
            "dataLabels": { "enabled": true, "format": "{point.y:.0f}%" },
            "data": {{variwide_data}}
        }]
}
Placeholder mapping legend:
{{lead_carrier}} → First carrier (alphabetical) → "Carrier1"
{{period_2}} → Latest product_period → "2025-1H"
{{variwide_data}} → Per category: {name: cat, y: COUNT(rank=1 AND carrier=Carrier1)/COUNT(rank=1)*100, z: COUNT(rank=1)} WHERE product_period='2025-1H'
→ [{"name": "Call", "y": 42.3, "z": 385}, {"name": "Data", "y": 23.8, "z": 290}, {"name": "Overall", "y": 32.0, "z": 303}, {"name": "Reliability", "y": 39.7, "z": 307}, {"name": "Responsiveness", "y": 18.2, "z": 319}, {"name": "SpCarrier4d", "y": 32.0, "z": 387}, {"name": "Text", "y": 33.5, "z": 520}, {"name": "Video", "y": 25.9, "z": 363}]
Chart 3: Win flow from 2024-2H to 2025-1H (all seven carriers)
The following streamgraph shows how first-place overall rankings flow between the two measurement periods (2024-2H to 2025-1H) for all seven carriers. Each carrier’s stream width is proportional to its number of first-place overall rankings, so wider streams indicate greater competitive dominance. You can see competitive momentum shifts , for example, Carrier3 maintains the widest stream across both periods (approximately 138 to 140 wins), indicating sustained dominance, while Carrier1 shows notable growth from 80 to 97 wins. This visualization type is not available in native Quick charts.
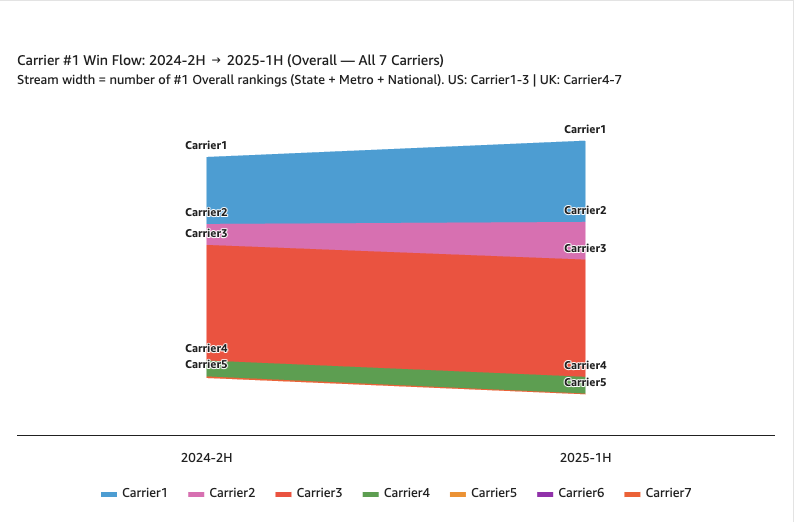
Streamgraph showing carrier 1 win flow from 2024-2H to 2025-1H for overall rankings across all seven carriers. Stream width represents number of first-place overall rankings. Carrier3 dominates with the widest stream, followed by Carrier1 showing growth from 80 to 97 wins.
{
    "chart": { "type": "streamgraph" },
    "title": { "text": "Carrier #1 Win Flow: {{period_1}} → {{period_2}} (Overall --- All {{carrier_count}} Carriers)" },
    "subtitle": { "text": "Stream width = number of #1 Overall rankings (State + Metro + National). {{country_carrier_split}}" },
    "xAxis": { "categories": {{period_list}}, "crosshair": true },
    "yAxis": { "visible": false },
    "legend": { "enabled": true },
    "tooltip": { "shared": true },
    "plotOptions": { "streamgraph": { "dataLabels": { "enabled": true, "format": "{series.name}" } } },
    "series": {{stream_series}}
}
Placeholder mapping legend:
{{period_1}} → "2024-2H"
{{period_2}} → "2025-1H"
{{carrier_count}} → COUNT(DISTINCT carrier) → 7
{{period_list}} → ["2024-2H", "2025-1H"]
{{country_carrier_split}} → "US: Carrier1-3 | UK: Carrier4-7"
{{stream_series}} → Per carrier: {name: carrier, color: color, data: [COUNT(rank=1 AND category='Overall') per period]}
→ [{"name": "Carrier1", "color": "#219FD7", "data": [80, 97]}, {"name": "Carrier2", "color": "#E66AB4", "data": [25, 45]}, {"name": "Carrier3", "color": "#FF4433", "data": [138, 140]}, {"name": "Carrier\...}
Chart 4: Performance radar chart — average RootScore by category
The following radar chart (polar line chart) profiles all seven carriers simultaneously across seven performance categories: Call, Data, Overall, Reliability, Responsiveness, Text, and Video. Each carrier appears as a colored polygon whose vertices represent the carrier’s average RootScore in each category for 2025-1H. The polygon grid starts at a minimum score of 70, so you can compare the overall shape and symmetry of each carrier’s performance profile. Carriers with larger, more uniform polygons perform consistently well across all categories, while irregular shapes reveal category specific strengths or weaknesses.
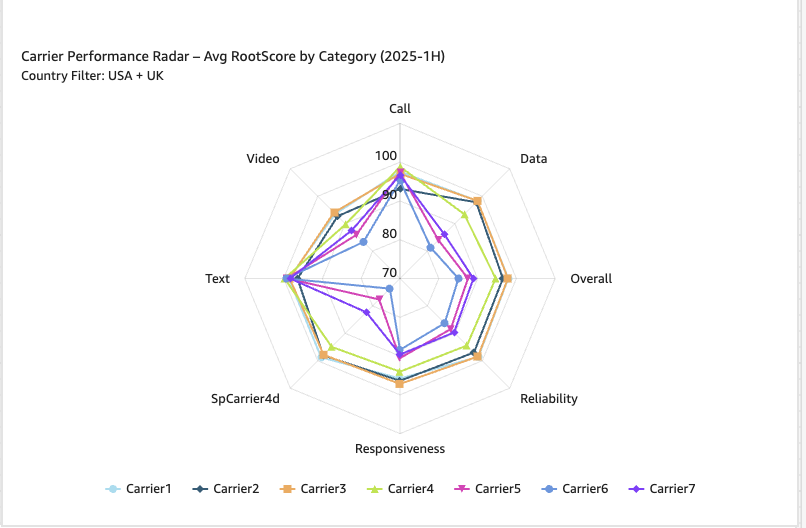
Radar chart showing carrier performance across categories (Call, Data, Overall, Reliability, Responsiveness, Text, Video) for 2025-1H. Seven colored polygons represent each carrier, with scores ranging from 70 to 100.
{
    "chart": { "polar": true, "type": "line" },
    "title": { "text": "Carrier Performance Radar -- Avg RootScore by Category ({{period_2}})" },
    "subtitle": { "text": "Country Filter: {{country_list}}" },
    "xAxis": { "categories": {{category_list}}, "tickmarkPlacement": "on", "lineWidth": 0 },
    "yAxis": { "gridLineInterpolation": "polygon", "lineWidth": 0, "min": 70 },
    "tooltip": { "shared": true },
    "series": {{radar_series}}
}
Placeholder mapping legend:
{{period_2}} → "2025-1H"
{{country_list}} → "UK + USA"
{{category_list}} → DISTINCT(category) → ["Call", "Data", "Overall", "Reliability", "Responsiveness", "SpCarrier4d", "Text", "Video"]
{{radar_series}} → Per carrier: {name: carrier, data: [AVG(rootscore) per category], pointPlacement: "on"} WHERE product_period='2025-1H'
Chart 5: Performance by category
The following packed bubble chart groups all seven carriers into distinct visual clusters, where each bubble within a cluster represents a performance category. Bubble size corresponds to the carrier’s average RootScore in that category for 2025-1H , larger bubbles indicate higher scores. US carriers (Carriers 1–3) and UK carriers (Carriers 4–7) appear with different color schemes, making it easy to compare cross-region performance at a glance. This chart type enables you to identify both the strongest overall performers (larger clusters) and category-specific outliers within each carrier’s profile.
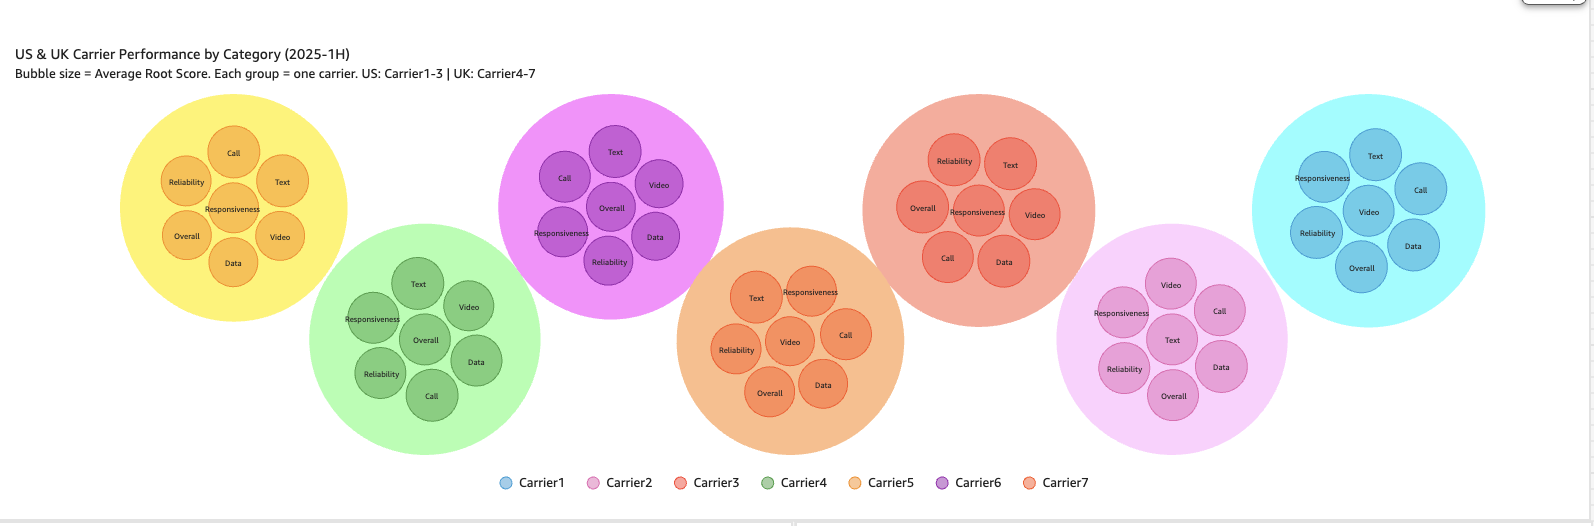
Packed bubble chart showing carrier performance by category for 2025-1H. Each carrier forms a distinct cluster of seven bubbles representing performance categories. Bubble size corresponds to average root score. US and UK carriers are shown with different color schemes.
{
    "chart": { "type": "packedbubble" },
    "title": { "text": "Carrier Performance by Category ({{period_2}})" },
    "subtitle": { "text": "Bubble size = Average Root Score. Each group = one carrier. {{country_carrier_split}}" },
    "tooltip": { "headerFormat": "", "pointFormat": "<b>{point.name}</b><br>Avg Score: <b>{point.value}</b>" },
    "plotOptions": {
        "packedbubble": {
            "minSize": "20%", "maxSize": "100%", "zMin": 0, "zMax": 100,
            "layoutAlgorithm": { "gravitationalConstant": 0.05, "splitSeries": true, "seriesInteraction": false, "dragBetweenSeries": false, "parentNodeLimit": true },
            "dataLabels": { "enabled": true, "format": "{point.name}", "style": { "textOutline": "none", "fontWeight": "normal" } }
        }
    },
    "series": {{packed_bubble_series}}
}
Placeholder mapping legend:
{{period_2}} → "2025-1H"
{{country_carrier_split}} → "US: Carrier1-3 | UK: Carrier4-7"
{{packed_bubble_series}} → Per carrier: {name: carrier, color: color, data: [{name: cat, value: AVG(rootscore)}]} WHERE product_period='2025-1H'
The following hexagonal tilemap provides an intuitive visual representation of carrier market share for 2025-1H. Each hexagon represents approximately 1% of total markets won, and hexagons are color-coded by carrier. The proportional fill creates an immediate sense of competitive concentration, you can see at a glance that Carrier3 (green) dominates with approximately 46.7% market share, followed by Carrier1 (blue) at 35.4%, Carrier4 (orange) at 9.7%, and Carrier2 (pink) at 7.7%. This abstract hex-grid approach is not possible with native Quick map visuals, which render only geographic shapes or coordinates.
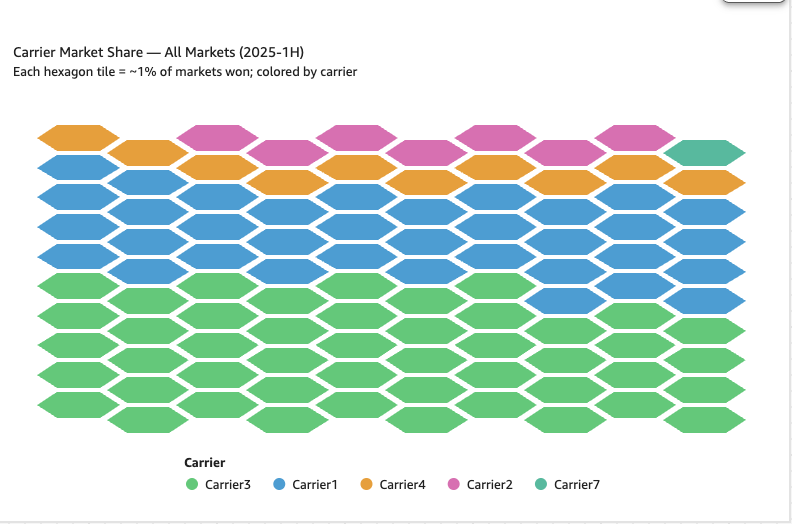
Hexagonal tilemap showing carrier market share for all markets in 2025-1H. Each hexagon represents approximately one percent of markets won, colored by carrier. Carrier3 (green) dominates with 46.7 percent market share, followed by Carrier1 (blue) at 35.4 percent, Carrier4 (orange) at 9.7 percent, and Carrier2 (pink) at 7.7 percent.
{
    "chart": { "type": "tilemap" },
    "title": { "text": "Carrier Market Share --- All Markets ({{period_2}})" },
    "subtitle": { "text": "Each hexagon tile = ~1% of markets won; colored by carrier" },
    "xAxis": { "visible": false },
    "yAxis": { "visible": false },
    "legend": { "enabled": true, "title": { "text": "Carrier" } },
    "tooltip": { "headerFormat": "" },
    "plotOptions": { "tilemap": { "tileShape": "hexagon", "dataLabels": { "enabled": false }, "pointPadding": 2 } },
    "series": {{tilemap_series}}
}
Placeholder mapping legend:
{{period_2}} → "2025-1H"
{{tilemap_series}} → Per carrier (sorted by share DESC): tiles proportional to market share %
→ Each tile = 1% of total markets won; arranged in 10-column hex grid
→ Share derived from: COUNT(rank=1 AND category='Overall' AND product_period='2025-1H') GROUP BY carrier
Security without sacrifice
A common enterprise concern with custom visualizations is security, specifically the risk that users could inject arbitrary JavaScript into a dashboard to exfiltrate data or compromise your application.
Your Highcharts configurations are treated as structured data, not executable code.
The rendering engine in Amazon Quick validates the JSON schema before passing it to the Highcharts library. It strips custom functions, event handlers, and formatter callbacks at the parameter layer so you get rich interactivity (tooltips, zoom, drill-downs) without ever executing user-supplied code.
This means your security team can approve a single Highcharts rendering policy once, and every visualization you build on that policy inherits the same security posture.
Extend your solution with Amazon Quick agentic features
Quick offers features that complement your multi-Region analytics dashboard and help you derive deeper insights from your data.
Using chat agents for natural language queries
With Amazon Quick chat agents, a capability of Amazon Quick, you can interact with your multi-Region dashboard using natural language. You can ask questions such as:
- “What were the top performing carriers in last quarter?”
- “Show me the trend of carrier performance across all regions.”
- “Compare carrier performance between US and UK.”
The chat agent understands your dashboard context and generates visualizations or provides data summaries on demand, making it easier for your non-technical users to explore multi-Region data without learning query syntax or dashboard navigation.
Organizing resources with spaces
Create a dedicated space in Quick Space for your multi-Region analytics project. Within this space:
- Upload supporting documentation about regional data sources and business definitions.
- Store your Highcharts configuration files for version control and team collaboration.
- Organize related dashboards, datasets, and analyses artifacts in one location.
- Share the space with your team members so that everyone has access to the same resources and context.
This centralized organization helps you maintain consistency across your analytics team and streamlines onboarding for new team members.
Automating workflows with Flows
Amazon Quick Flows can automate repetitive tasks related to your multi-Region analytics:
- Automated reporting – Create a Flow that generates and distributes weekly multi-Region performance reports to stakeholders by email.
- Alert notifications – Set up a Flow to monitor your key metrics across regions and send you alerts when thresholds are exceeded, so you can respond proactively to issues.
- Data refresh coordination – Automate the process of refreshing data from multiple regional sources and updating your dashboards on a defined schedule.
- Insight generation – Build a Flow that analyzes your regional performance variations and generates summary insights for your executive review.
Through these Amazon Quick features with your Highcharts visualizations, you create a comprehensive analytics solution that displays your data effectively and helps you collaborate on analyses, automate workflows, and interact with your multi-Region data using natural language.
Clean up
Warning: Deletion of Quick resources is permanent and can’t be undone. Confirm that you have backups of any analyses, dashboards, or datasets you want to retain before proceeding. If you’re unsure whether a resource is used in production, consult with your team before deleting it.
If you created resources specifically for testing this solution, you can delete them to avoid incurring ongoing charges:
- In the Quick console, navigate to Datasets under Quick.
- Select any test datasets you created and choose Delete. Confirm the deletion for each data source.
- Navigate to Dashboards and delete any test dashboards you no longer need.
- Navigate to Analyses and delete any test analyses you no longer need.
- Review your SPICE capacity usage and release any capacity you allocated to deleted datasets.
- If you created specific IAM roles or policies for this implementation, review them in the IAM console and remove those that you no longer require.
- Delete any test spaces, chat agents, or flows that you no longer need.
Conclusion
In this post, you learned how to extend Amazon Quick with Highcharts custom visualizations to build multi-Region carrier performance dashboards that meet data sovereignty requirements. By federating aggregated datasets at the Quick layer, you maintain adherence with UK GDPR and US data residency rules while delivering unified visualizations across all carriers.
The Highcharts chart types demonstrated address visualization requirements that native Quick charts can’t meet. Because these configurations bind dynamically to Quick field wells and use a central lookup table, your dashboards scale automatically as you add new carriers or Regions.
About the authors
— Originally published at aws.amazon.com
Want this in your inbox every morning?
Daily brief at your local 8am — bilingual EN/中文, free.
More from AWS Machine Learning
See more →

Building an agentic app deployer with Amazon Bedrock and AWS Lambda
PDI Technologies developed PDI Brew, enabling non-technical employees to create web applications on AWS without developer involvement, leveraging Amazon Bedrock for AI capabilities. This agentic app deployer streamlines internal tool delivery, removing traditional bottlenecks in deployment pipelines.